Earlier this year when launching this blog we explained why R package developers should care about R-hub. So, does anyone care? 😉 Yes! Let’s summarize R-hub usage.
Usage data
As specified in our use terms we do not store user data. However we do store some usage data. In the table loaded below, emails and packages are unidentified – but you can know whether an email or package comes up several times.
builds <- tibble::as_tibble(readRDS(my_not_portable_path))
builds
## # A tibble: 84,996 x 8
##    email package platform status submitted           started
##    <chr> <chr>   <chr>    <chr>  <dttm>              <dttm>
##  1 9a16… b64e51… windows… error  2018-03-15 07:23:17 NA
##  2 9a16… b64e51… macos-e… ok     2018-03-16 05:44:39 2018-03-16 05:44:43
##  3 9a16… b64e51… debian-… ok     2018-03-16 05:48:19 2018-03-16 05:48:24
##  4 9a16… b64e51… windows… ok     2018-03-16 06:03:35 NA
##  5 9a16… b64e51… linux-x… ok     2018-03-16 06:05:23 2018-03-16 06:05:28
##  6 9a16… b64e51… ubuntu-… ok     2018-03-16 06:09:44 2018-03-16 06:09:49
##  7 9a16… b64e51… debian-… ok     2018-03-16 06:25:04 2018-03-16 06:25:08
##  8 9a16… b64e51… debian-… ok     2018-03-16 06:36:19 2018-03-16 06:36:24
##  9 9a16… b64e51… debian-… ok     2018-03-16 06:43:25 2018-03-16 06:43:29
## 10 9a16… b64e51… windows… error  2018-03-16 06:57:38 NA
## # … with 84,986 more rows, and 2 more variables: build_time <dbl>, ui <chr>
A recent increase in usage
Towards 1,000 builds a week?
library("ggplot2")
library("magrittr")
dplyr::mutate(builds,
             week = as.Date(cut(submitted, "week"))) %>%
  dplyr::count(week) %>%
ggplot(aes(week, n)) +
  geom_point() +
  geom_smooth() +
  ylab("No. of buids") +
  xlab("Time (weeks)") +
  hrbrthemes::theme_ipsum(base_size = 16,
                          axis_title_size = 16)
## `geom_smooth()` using method = 'loess' and formula 'y ~ x'
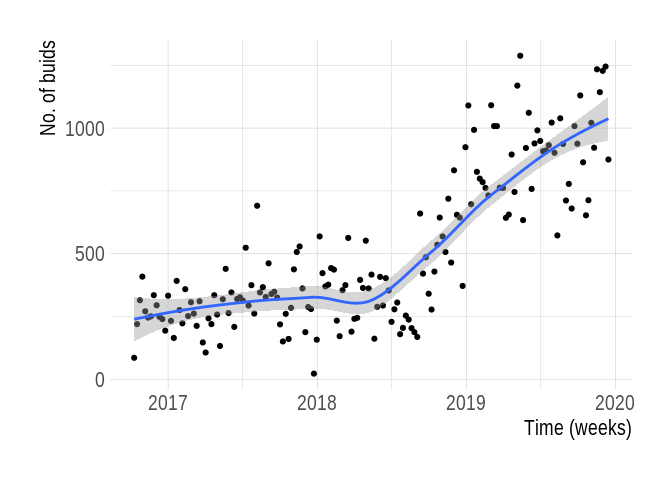
When plotting the weekly count of builds as below, it is quite clear that usage stepped up at the end of last year. A delayed effect of the RStudio webinar about R-hub?
Number of unique packages built per week
dplyr::mutate(builds,
             week = as.Date(cut(submitted, "week"))) %>%
  dplyr::group_by(week) %>%
  dplyr::summarise(n = length(unique(package))) %>%
ggplot(aes(week, n)) +
  geom_point() +
  ylab("No. of packages built") +
  xlab("Time (weeks)")  +
  geom_smooth() +
  hrbrthemes::theme_ipsum(base_size = 16,
                          axis_title_size = 16)
## `geom_smooth()` using method = 'loess' and formula 'y ~ x'
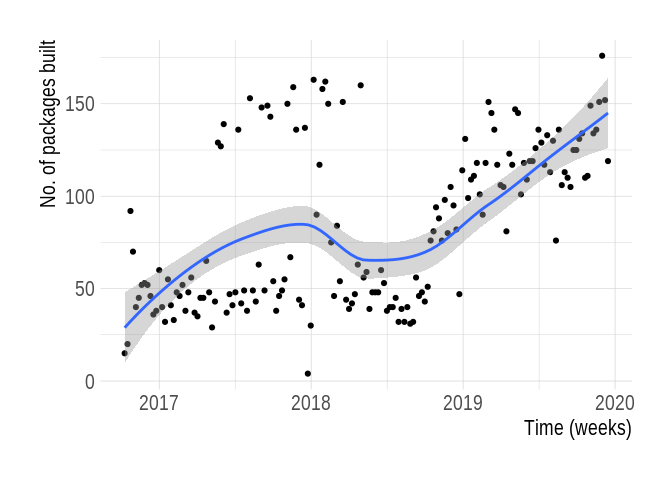
The number of unique packages built mostly follow the number of builds apart from a stagnation last year.
Number of unique users per week
What about the number of users?
dplyr::mutate(builds,
             week = as.Date(cut(submitted, "week"))) %>%
  dplyr::group_by(week) %>%
  dplyr::summarise(n = length(unique(email))) %>%
ggplot(aes(week, n)) +
  geom_point() +
  geom_smooth() +
  ylab("No. of distinct email addresses") +
  xlab("Time (weeks)") +
  hrbrthemes::theme_ipsum(base_size = 16,
                          axis_title_size = 16)
## `geom_smooth()` using method = 'loess' and formula 'y ~ x'
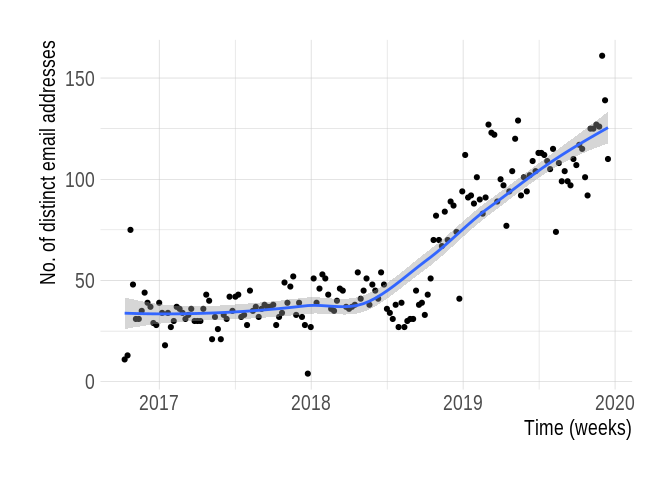
So all in all, the R-hub package builder is serving more and more users and packages.
Platform usage
Choosing a platform or platforms for your package check might seem daunting. Luckily we’ve written up some guidance in our docs!
Most frequently used platforms
builds %>%
  dplyr::count(platform, sort = TRUE) %>%
  head(n = 7) %>%
  knitr::kable()
platform n
ubuntu-gcc-release 19490 windows-x86_64-devel 16831 fedora-clang-devel 16136 linux-x86_64-rocker-gcc-san 6057 debian-gcc-devel 4294 windows-x86_64-release 4161 macos-elcapitan-release 3077
The most frequently used platforms reflect the default platforms (ubuntu-gcc-release for the web interface), including the default platforms mix for rhub::check_for_cran() (windows-x86_64-devel, ubuntu-gcc-release, fedora-clang-devel and if the package needs compilation linux-x86_64-rocker-gcc-san).
Newest platforms
What platforms were added to the pool this year?
builds %>%
  dplyr::group_by(platform) %>%
  dplyr::filter(lubridate::year(as.Date(min(submitted))) == 2019) %>%
  dplyr::summarise(first = as.Date(min(submitted))) %>%
  knitr::kable(format = "markdown")
| platform | first |
|---|---|
| debian-clang-devel | 2019-04-12 |
| debian-gcc-devel-nold | 2019-05-16 |
| windows-x86_64-devel-rtools4 | 2019-03-01 |
The youngest platforms are r-devel-linux-x86_64-debian-clang and its special encoding, a noLD platform, the experimental Windows Rtools4.0 platform.
Web interface or R package?
Although R-hub package builder has a working web interface, we recommend using the rhub package for submitting builds. Since March this year, for builds we record whether they were submitted via the web interface or the package.
(ui <- table(builds$ui))
##
##   api   web
## 33456  2259
So, 93.7% of builds were submitted via the rhub package. Great!
Conclusion
In this post we presented a few figures underlining the growth in R-hub usage, and the variety of platforms used for checking packages – one of R-hub’s selling points. In total, over time, the R-hub package builder has been used by 2507 users for 4418 packages. For comparison at the time of writing there are 15670 packages on CRAN.
We hope to keep helping package developers check their packages and debug issues, in particular thanks to the package builder, its docs, and this blog. Thanks to all users who notified problems and suggested enhancements via GitHub or gitter, keep your feedback and questions coming!