Version 2.1.1 of the cranlogs package has been released on CRAN!
cranlogs queries a web API maintained by R-hub that contains the daily download numbers for each package and for R itself from the RStudio CRAN mirror.
📈
Get cranlogs’s latest version from CRAN, hopefully from RStudio CRAN mirror so we can monitor counts.
😉
install.packages("cranlogs", repos = "https://cran.rstudio.com/")
The changes brought by this version mostly are a few docs and bug fixes 👋 🐛, but also the addition of a brand-new function simplifying your use of cranlogs badges, cranlogs_badge()!
Since it is the first time we blog about cranlogs after its transfer to R-hub, we shall use the rest this blog post as an introduction to it.
cranlogs, how and why?
cranlogs data source and its quality
RStudio publishes the download logs from their CRAN package mirror daily at http://cran-logs.rstudio.com.
The cranlogs package queries a web API maintained by R-hub that contains the daily download numbers for each package.
The RStudio CRAN mirror is not the only CRAN mirror, but it’s a popular one: it’s the default choice for RStudio users. The actual number of downloads over all CRAN mirrors is unknown. Therefore, using numbers of downloads from that mirror is a proxy for actual numbers of downloads, and when analysing it one has to assume the observed trends are representative of what happens via other mirrors.
The data cranlogs queries has other limitations such as re-download/CRAN mirror spikes due to package updates that can be corrected, if you want, by the use of the adjustedcranlogs package by Tyler Morgan-Wall.
Refer to that package documentation and code to find out more about it adjusts the download counts.
For another type of context information about the download counts, refer to the brand-new and in development packageRank package by lindbrook that provides ranks for packages.
cranlogs use cases
Now, why would you even be interested in the download counts of packages and R? As a package maintainer, is it only egosurfing?
Probably not, such data can be useful:
-
As the developer, you can e.g. assess effect of promotion efforts, and maybe use proof of your package’s popularity in career reports? (Note that it is perfectly fine to maintain a small niche package!
cranlogsitself is noggplot2. 😉) -
As the potential user, you can use download counts to compare popularity of packages you’re hesitating to use. Again, quality does not necessitate popularity but a higher usage can be a good sign, in particular a good sign of the probability to get help from other users.
-
You could also use download counts as a way to summarize the “most important” packages around a topic, like what Zev Ross did below with spatial packages (the code attached to the tweet, available as a GitHub gist, uses the list of packages of the spatial CRAN task view, get their downloads with
cranlogs, and sort them by popularity). Note that the R-hubpkgsearchpackage returns the downloads of last month for search results!
For reference, this is a list of the monthly downloads for packages from the R spatial task view. Beyond this, mapview is ranked 26 with 19k downloads and tmap is 29th with 16k downloads, #rstats pic.twitter.com/cGQyU6OsMS
— Zev Ross (@zevross) April 30, 2019
How to use cranlogs?
We shall first show how to use cranlogs from within R.
Most popular packages
The package has two functions to get downloads, one to query downloads by package name (with “R” giving downloads for R itself), one to query downloads for the top count downloaded packages from the RStudio CRAN mirror.
So, what were the most popular packages over the last month?
cranlogs::cran_top_downloads(when = "last-month")
##    rank    package   count       from         to
## 1     1      rlang 1031362 2019-03-31 2019-04-29
## 2     2       Rcpp  888903 2019-03-31 2019-04-29
## 3     3      dplyr  822528 2019-03-31 2019-04-29
## 4     4   devtools  818129 2019-03-31 2019-04-29
## 5     5    ggplot2  811036 2019-03-31 2019-04-29
## 6     6     tibble  775563 2019-03-31 2019-04-29
## 7     7 data.table  721868 2019-03-31 2019-04-29
## 8     8       glue  664281 2019-03-31 2019-04-29
## 9     9        cli  655877 2019-03-31 2019-04-29
## 10   10     pillar  637211 2019-03-31 2019-04-29
Were these packages the ones you expected?
The when argument can take 3 values: “last-day” is the last day for which data is available (often two days before today), “last-week” is from 6 days prior to that last day with data, “last-month” is from 29 days prior to that last day with data.
Downloads of cranlogs itself
Let’s have a look at the downloads of a much less popular package, cranlogs!
😎 The cranlogs::cran_downloads() function also has the when argument, but you can also specify a more flexible interval by using from and to, both either dates or a string in the yyyy-mm-dd format.
Below we’re setting from to “2015-05-07” because that’s when cranlogs was first released on CRAN.
library("ggplot2")
dl <- cranlogs::cran_downloads("cranlogs",
                               from = "2015-05-07",
                               to = "2019-04-24")

ggplot(dl, aes(date, count)) +
  geom_point() +
  geom_smooth() +
  viridis::scale_colour_viridis(discrete = TRUE) +
  theme_minimal() +
  hrbrthemes::theme_ipsum(base_size = 16,
                          axis_title_size = 16) +
  xlab("Time") +
  ylab("No. of downloads") +
  ggtitle("Daily count of downloads of the R-hub cranlogs package",
          subtitle = "Downloads from the RStudio CRAN mirror. Data queried with {cranlogs} itself ;-)")
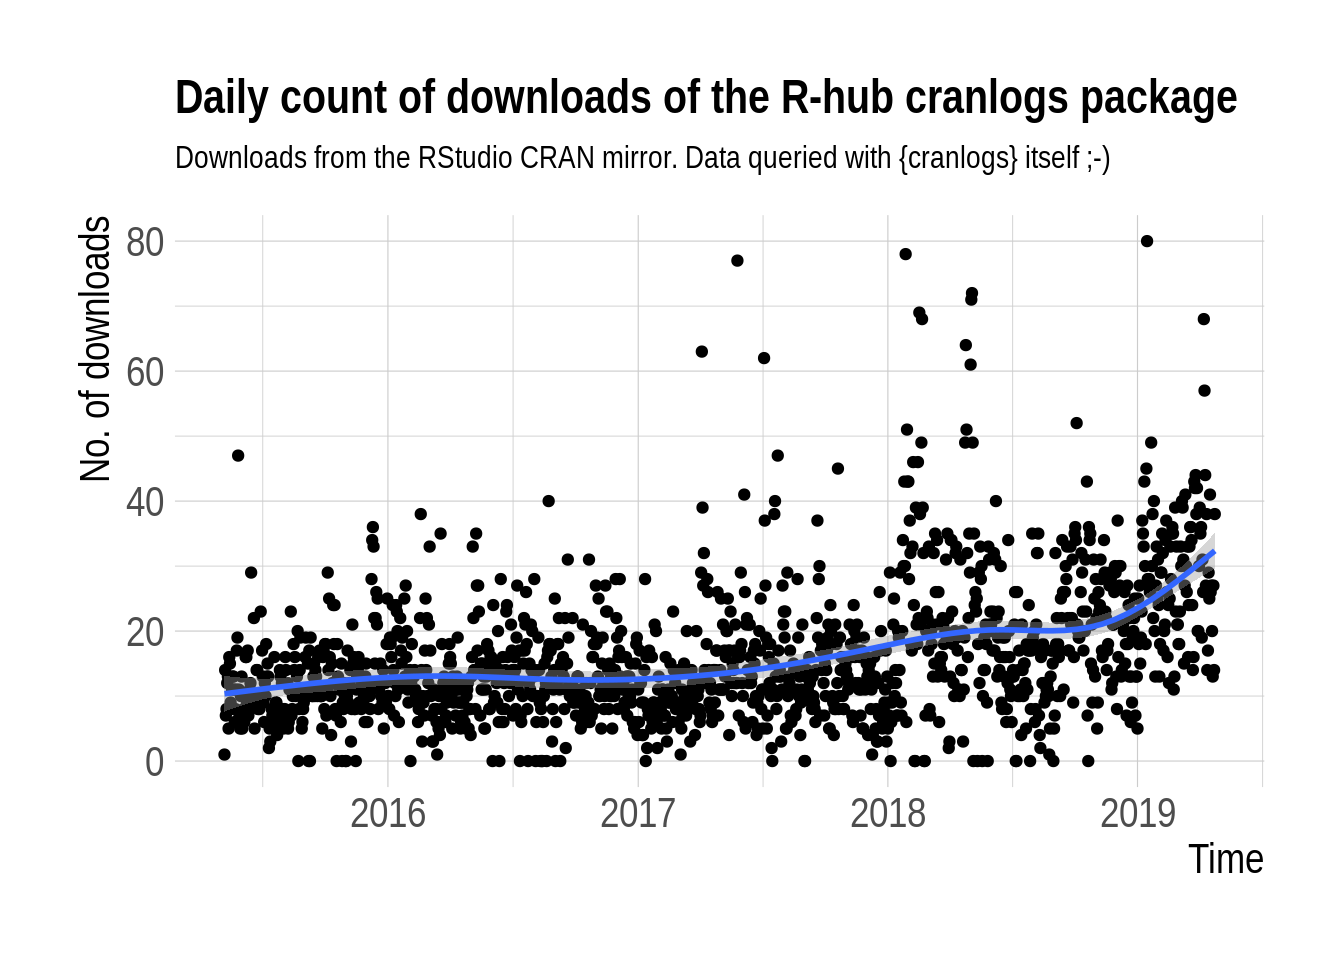
Figure 1 Time series of cranlogs downloads showing a few dozens of downloads a day, with an upward trend since 2018.
These aren’t huge download counts, but there’s an upward trend! More awareness of the package existence, or more package developers egosurfing? 🏄 😉
cranlogs on the web
If you wish to have a quick look at downloads count time series without even firing up your own R session, you can use Hadley Wickham’s online handy Shiny app, whose source code uses cranlogs.
cranlogs badges, or how to show off usage
Are you into README badges?
You can add a cranlogs badge for each of your packages!
cranlogs badges were the third most popular type of badges in a sample of CRAN packages studied in an rOpenSci tech note.
You can tweak two aspects of the badges: the time period over which to compute the number of downloads, and the color of the badge.
To create the Markdown code for the badge, you could use the badger package or cranlogs::cranlogs_badge()!
Below are some examples:
cranlogs::cranlogs_badge("cranlogs")
## [1] "[](https://r-pkg.org/pkg/cranlogs)"
Resulting badge:
cranlogs::cranlogs_badge("cranlogs", summary = "grand-total")
## [1] "[](https://r-pkg.org/pkg/cranlogs)"
Resulting badge:
Available colours by name are “brightgreen”, “green”, “yellowgreen”, “yellow”, “orange”, “red”, “lightgrey”, “blue”.
cranlogs::cranlogs_badge("cranlogs", summary = "last-week",
                         color = "orange")
## [1] "[](https://r-pkg.org/pkg/cranlogs)"
Resulting badge:
The colour can also be any hex code so there’s no limit to your creativity (you might want to check contrast, though). 🌈
cranlogs::cranlogs_badge("cranlogs", color = "ff8c69")
## [1] "[](https://r-pkg.org/pkg/cranlogs)"
Resulting badge:
Conclusion
In this post we’ve presented the cranlogs package that makes download counts from RStudio CRAN mirror available in R.
The web API that powers it is used by another packages, dlstats by Guangchuang Yu that also features Bioconductor download stats.
The best place to get to know cranlogs is its brand-new documentation website built with pkgdown, and the best place to provide feedback or contribute is its GitHub repo.
Also feel free to report your use cases via gitter or Twitter!
Thanks to all folks who chimed in in the issue tracker and pull request tab!